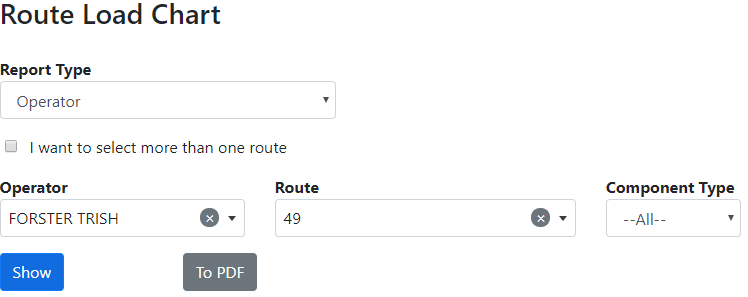
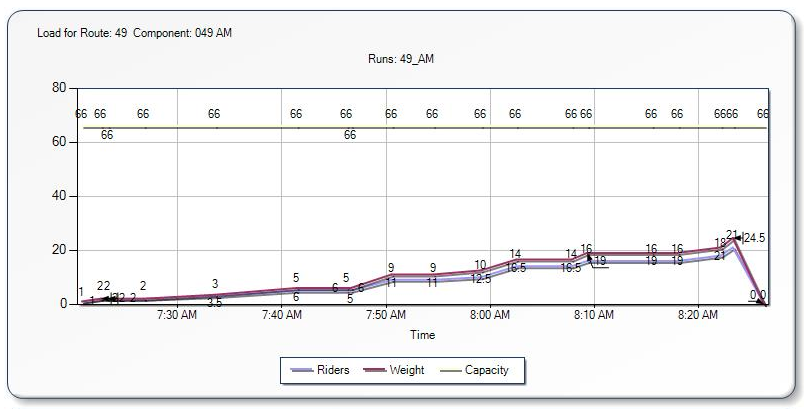
The Route Load Chart allows you to see a line chart which displays the load of a bus at any given point. Each individual bus stop is represented by a point on a line. When you hover over a point, you can see the time that the bus gets to the stop and the load at that stop.

Route Load Chart – Results

The three separate lines on the resulting chart are described in the legend at the bottom of the chart, and are as follows:
•The top line is the maximum capacity of the route.
•The lowest line is the physical number of student riders on the bus.
•The middle line is the weighted load of student riders on the bus, which depends on the grades of the students and their associated “weights”. This should never exceed the maximum capacity.
If you hover over any of the points on the line chart, you will receive a tool tip box which will tell you the time of the stop and the relative student information. For the rider line, the students will be counted as single riders. For the weighted line, the students will be multiplied by their weighted value.